
Work and Wages at a Glance
This slideshow steps through five labour-market indicators, one frame at a time. Each frame ranks the economies covered, marks where the highlighted country falls, and traces that country's path over the past decade. All figures come from World Bank World Development Indicators modeled ILO estimates for the latest available year.
| Unemployment rate | 70 | US unemployment is 4.198%, 70th of 187 economies |
| Labour force participation rate | 92 | US labour force participation is 61.704%, 92nd of 187 economies |
| Wage and salaried workers | 8 | Wage and salaried workers are 93.926% of US employment, 8th of 187 |
| Female-to-male participation ratio | 66 | The US female-to-male participation ratio is 84.021%, 66th of 187 |
| Employment in industry | 93 | Industry accounts for 18.912% of US employment, 93rd of 187 |
Read each frame on its own: the bar chart shows the ranking within that single indicator, and the line below shows only the highlighted country's own history. Do not compare values or ranks across frames — the indicators use different definitions and rank direction, and the number of countries covered can differ.
Key points
Across the five labour-market indicators in this edition, the United States looks strongest not in how many people work, but in how they are employed. The clearest example is the share of wage and salaried workers: 93.9% of American employment, ranking 8th out of 187 economies, against a world value of 53.6%. Unemployment, at 4.198%, places the US 70th of 187 and sits a little below the world value of 4.791%, while the labour force participation rate of 61.704% (92nd) is only marginally above the world figure of 60.979%. The ratio of female to male participation, 84.0% (66th), is well above the world value of 69.6%, and employment in industry, 18.9% (93rd), runs below the world value of 23.7%.
(Source: World Bank, World Development Indicators — modeled ILO estimates.)
The latest figure for the central indicator
The lead indicator here is the unemployment rate. The United States records 4.198% for 2025, ranking 70th among 187 economies, where rank 1 goes to the *lowest* value rather than the highest. The world value for the same indicator is 4.791%, so the US figure is roughly 0.6 percentage points below the global reading — a modest gap rather than a dramatic one. In other words, the US sits in the better half of the distribution on unemployment, but not near its leading edge.
(Source: World Bank, "Unemployment, total (% of total labor force) (modeled ILO estimate)", SL.UEM.TOTL.ZS.)
Who is at the top and who is at the bottom
The lowest recorded unemployment rates belong to Qatar (0.13%), Cambodia (0.263%), Niger (0.394%), Thailand (0.781%) and Burundi (0.922%) — a list that mixes high-income oil exporters with low-income economies, which suggests that measurement coverage and the size of informal employment matter as much as labour demand. At the other end are Eswatini (34.202%), South Africa (32.391%), Djibouti (26.015%), Botswana (24.477%) and Palestine (24.42%), with southern Africa heavily represented. The United States, at 4.198%, falls on the lower-unemployment side of this range, though it is about 4.07 points above first-placed Qatar and far from the bottom group.
(Source: World Bank, SL.UEM.TOTL.ZS, modeled ILO estimate.)
How it has changed over the past decade
US unemployment fell from 6.168% in 2014 to 3.669% in 2019, rose sharply to 8.055% in 2020, then came back down to 3.638% in 2023 before edging up to 4.198% in 2025 — a net decline of about 1.97 points over the period, with one very large interruption. Labour force participation moved in a narrow band: 62.447% in 2014, a high of 62.848% in 2019, and 61.704% in 2025, about 0.74 points lower than at the start. The share of wage and salaried workers rose from 93.107% to 93.926% (+0.82 points), and the female-to-male participation ratio from 81.736% to 84.021% (+2.29 points), the largest gain of the five. Employment in industry drifted down from 19.836% to 18.912%, a fall of about 0.92 points.
(Source: World Bank WDI, SL.UEM.TOTL.ZS, SL.TLF.CACT.ZS, SL.EMP.WORK.ZS, SL.TLF.CACT.FM.ZS, SL.IND.EMPL.ZS.)
Compared with similar countries
Among the large economies shown here, US unemployment of 4.198% (70th) is lower than France's 7.542% (131st), close to the UK's 4.746% (80th) and China's 4.615% (76th), and higher than Germany's 3.711% (63rd), South Korea's 2.683% (29th) and Japan's 2.451% (24th) — a gap of about 1.75 points to Japan. On participation, the US at 61.704% trails China (64.551%), South Korea (64.351%) and Japan (63.448%), and leads Germany (60.571%) and France (55.346%). The clearest US lead is in wage and salaried employment: 93.926% against Germany's 91.851%, Japan's 90.949%, the UK's 86.851%, France's 86.715%, South Korea's 77.330% and China's 62.332% — a spread of more than 31 points to China. On the female-to-male ratio, the US at 84.021% sits behind the UK (87.403%), France (86.448%) and China (84.677%), and ahead of Germany (83.701%), South Korea (78.862%) and Japan (78.213%). In industry employment the US, at 18.912%, is the second lowest of this group after the UK (15.914%), well under China (31.792%) and Germany (25.974%).
(Source: World Bank WDI, modeled ILO estimates for all five indicators.)
How to read these numbers
All five series are modeled ILO estimates published through the World Bank, so they are harmonised for cross-country comparison and may not match figures released by national agencies such as the Bureau of Labor Statistics. Unemployment counts people who are available for and actively seeking work; it generally excludes those who have stopped searching and does not capture involuntary part-time work. Participation is measured against the population aged 15 and over, so it is influenced by the age structure of a country as well as by labour demand. The female-to-male figure is a ratio between two participation rates, not the female participation rate itself, and it says nothing about pay, hours or job type. Note also that although this edition is titled "work and wages", none of the indicators here measures wage levels — "wage and salaried workers" describes employment status, not earnings. The data are updated annually and the most recent year is an estimate, so small differences of a few tenths of a point are best treated with caution.
(Source: World Bank, World Development Indicators, https://data.worldbank.org/indicator/SL.UEM.TOTL.ZS and related series.)
Unemployment rate on the map and in charts
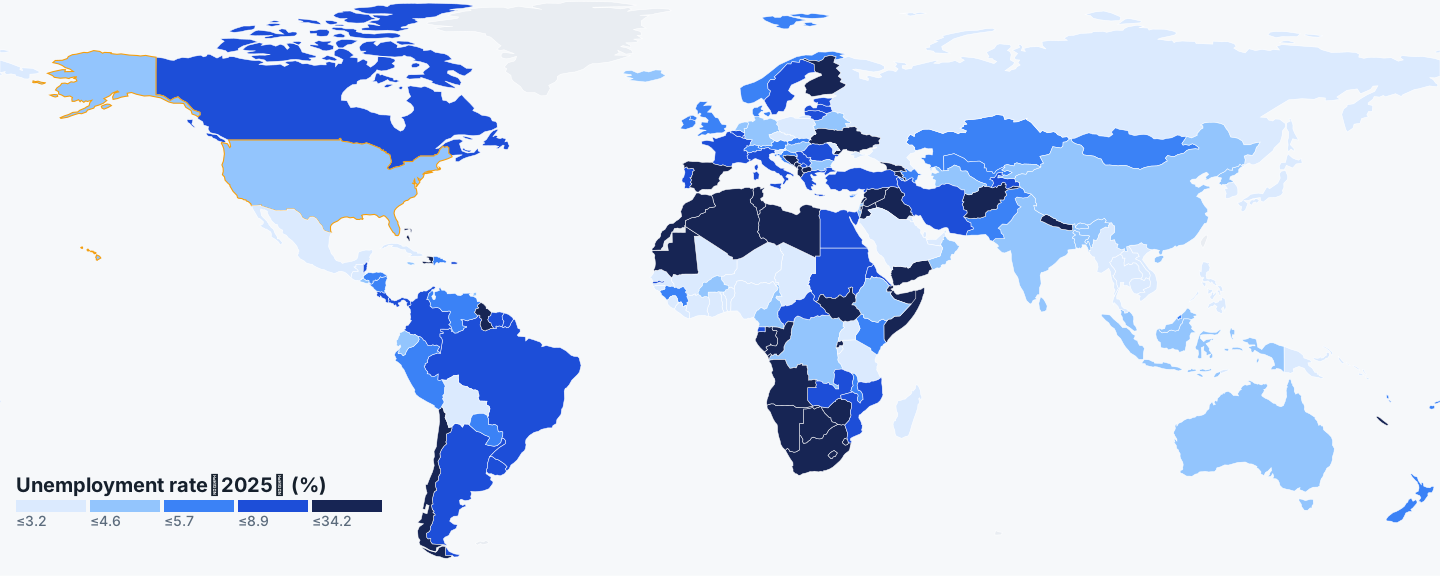
The table runs from Qatar (0.13%), Cambodia (0.263%) and Niger (0.394%) at the low end to Eswatini (34.202%), South Africa (32.391%) and Djibouti (26.015%) at the high end. The US at 4.198% falls on the lower-unemployment side, ahead of France (7.542%) but behind Japan (2.451%).
The bars show how tightly packed the middle of the distribution is compared with the long tail above 20%. The trend line marks the 2020 spike to 8.055% and the return to 3.638% in 2023 before the rise to 4.198%.
Compare countries
Labour force participation rate
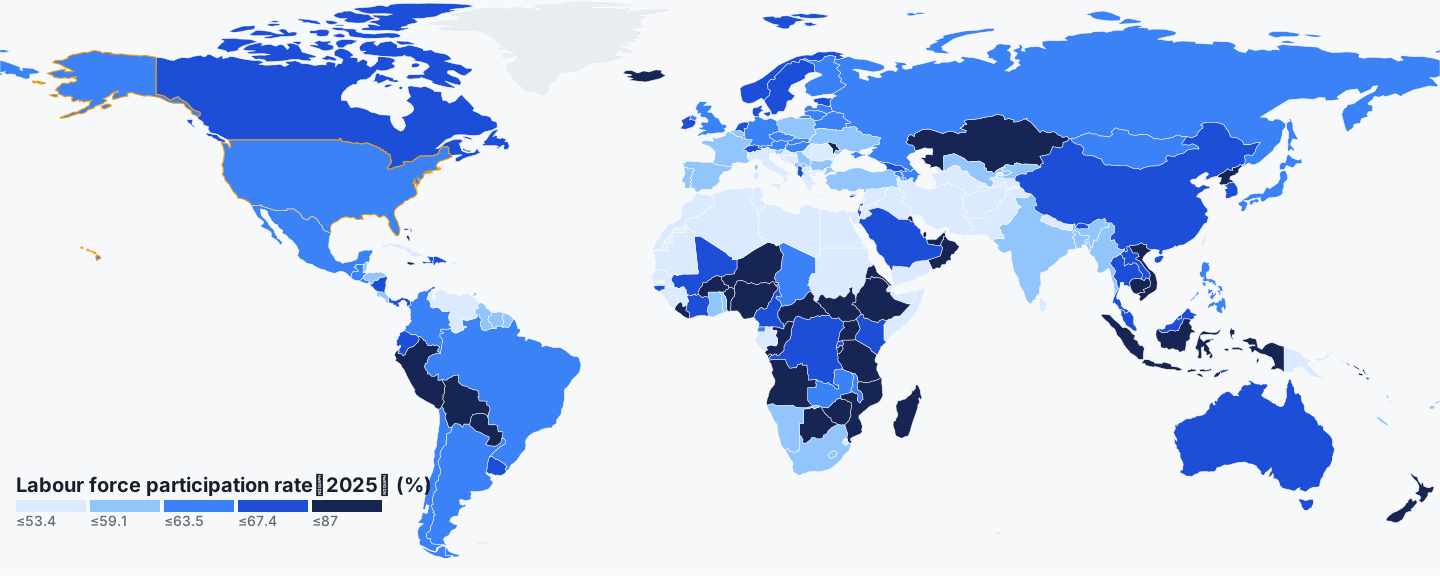
| Rank | Country / area | % |
|---|---|---|
| 1 | Qatar | 87.01 |
| 2 | Madagascar | 85.5 |
| 3 | Solomon Islands | 84.3 |
| 4 | Tanzania | 83.72 |
| 5 | Nigeria | 82.52 |
| 90 | Zambia | 61.93 |
| 91 | Argentina | 61.91 |
| 92 | US | 61.7 |
| 93 | Mexico | 61.61 |
| 94 | Luxembourg | 61.5 |
| 185 | Yemen | 33.1 |
| 186 | Djibouti | 31.74 |
| 187 | São Tomé & Príncipe | 23.34 |
Qatar (87.013%), Madagascar (85.495%) and the Solomon Islands (84.296%) lead, while São Tomé & Príncipe (23.342%), Djibouti (31.744%) and Yemen (33.103%) trail. The US sits mid-table, below China (64.551%) and Japan (63.448%) but above Germany (60.571%).
The bar chart spans more than 60 points from top to bottom, so mid-table gaps are small by comparison. The US line moved within a narrow band, from 62.447% in 2014 to a 2019 high of 62.848% and 61.704% in 2025.
Wage and salaried workers
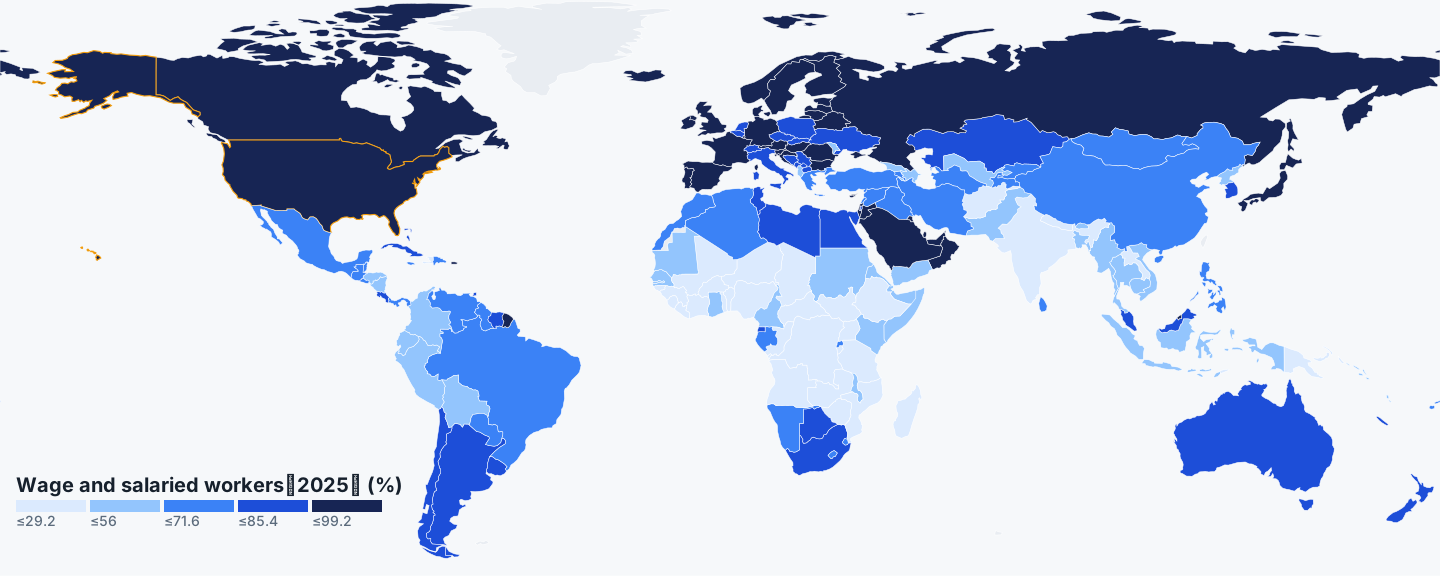
| Rank | Country / area | % |
|---|---|---|
| 1 | Qatar | 99.17 |
| 2 | Bahrain | 97.56 |
| 3 | Kuwait | 96.84 |
| 4 | Norway | 95.13 |
| 5 | Oman | 95.04 |
| 6 | United Arab Emirates | 94.93 |
| 7 | Saudi Arabia | 94.45 |
| 8 | US | 93.93 |
| 9 | Russia | 93.68 |
| 10 | Macao | 93.24 |
| 185 | Sierra Leone | 11.19 |
| 186 | Niger | 10.52 |
| 187 | Chad | 8.44 |
Qatar (99.168%), Bahrain (97.559%) and Kuwait (96.839%) top the table; Chad (8.439%), Niger (10.522%) and Sierra Leone (11.192%) sit at the bottom. The US appears in the top ten itself, just behind Saudi Arabia (94.453%) and ahead of Russia (93.677%).
The bars stretch from under 10% to over 99%, one of the widest spreads in this set. The US line rose gently from 93.107% in 2014 to 93.926%, a change of well under one point across the decade.
Female-to-male participation ratio
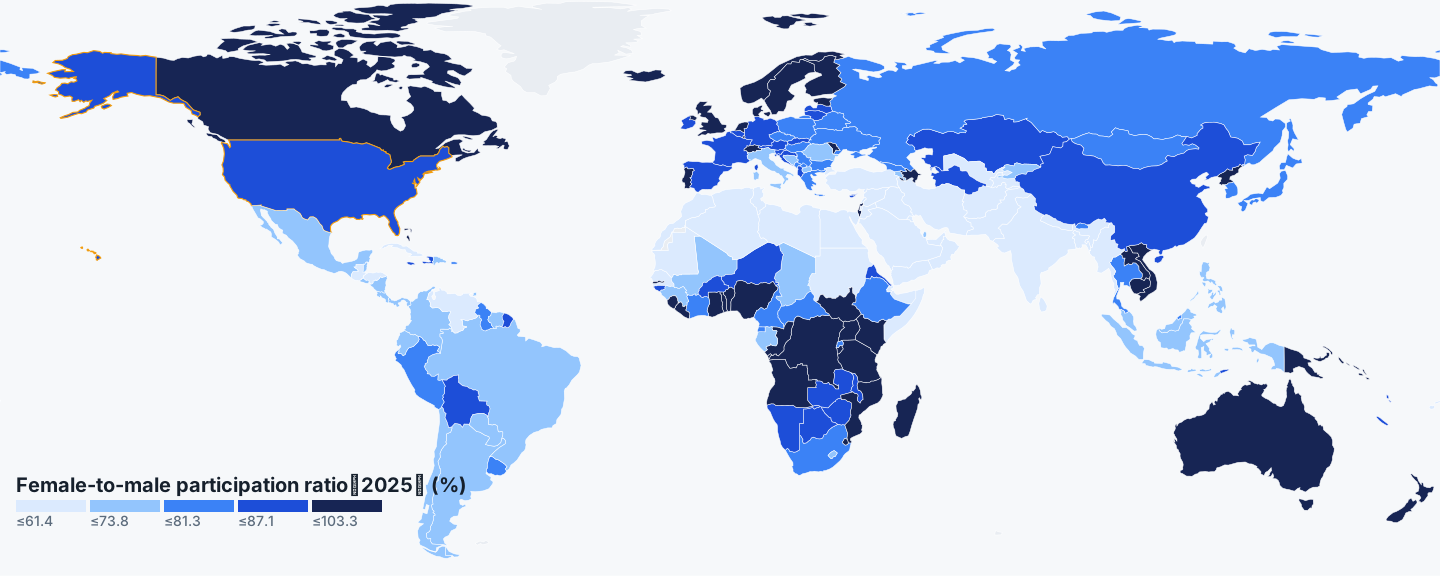
| Rank | Country / area | % |
|---|---|---|
| 1 | Burundi | 103.28 |
| 2 | Moldova | 100.12 |
| 3 | Benin | 96.91 |
| 4 | Togo | 95.93 |
| 5 | Mozambique | 95.74 |
| 64 | Burkina Faso | 84.16 |
| 65 | Niger | 84.13 |
| 66 | US | 84.02 |
| 67 | Germany | 83.7 |
| 68 | Zimbabwe | 83.69 |
| 185 | Iraq | 15.07 |
| 186 | Yemen | 7.62 |
| 187 | Afghanistan | 7.29 |
Burundi (103.283%), Moldova (100.123%) and Benin (96.913%) head the table, while Afghanistan (7.291%), Yemen (7.616%) and Iraq (15.069%) close it. The US sits above Germany (83.701%) and Japan (78.213%) but below the UK (87.403%) and France (86.448%).
The bar chart shows a very long low tail rather than a smooth gradient. The US line climbed steadily from 81.736% in 2014 to 84.021%, the largest decade change of the five indicators shown here.
Employment in industry
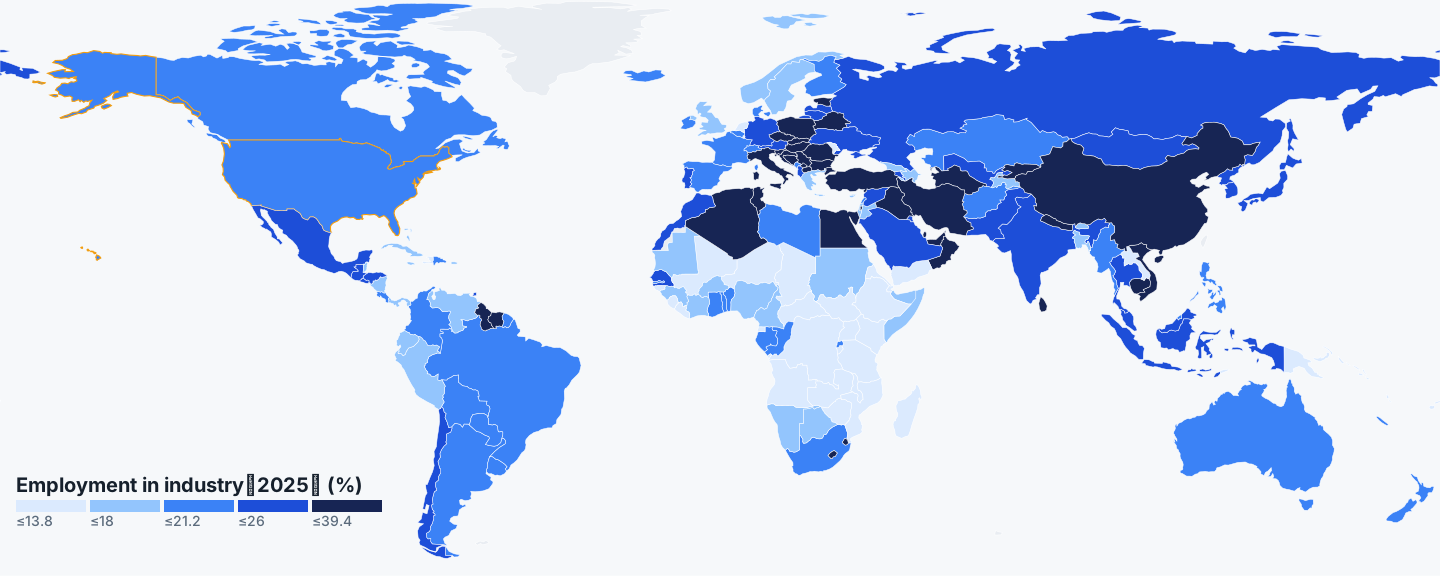
| Rank | Country / area | % |
|---|---|---|
| 1 | Oman | 39.44 |
| 2 | Qatar | 38.02 |
| 3 | Bahrain | 34.91 |
| 4 | Czechia | 34.89 |
| 5 | Vietnam | 34.83 |
| 91 | Dominican Republic | 18.97 |
| 92 | Paraguay | 18.95 |
| 93 | US | 18.91 |
| 94 | Afghanistan | 18.9 |
| 95 | Gabon | 18.85 |
| 185 | Timor-Leste | 3.8 |
| 186 | Burundi | 3.1 |
| 187 | South Sudan | 1.67 |
Oman (39.435%), Qatar (38.020%) and Bahrain (34.906%) lead, with South Sudan (1.672%), Burundi (3.103%) and Timor-Leste (3.804%) at the far end. The US sits below the midpoint, under Germany (25.974%) and Japan (23.229%) but above the UK (15.914%).
The bars show most economies clustered between roughly 15% and 35%, with a thin tail below 8%. The US line declines gradually from 19.836% in 2014 to 18.912%, a drift of under one point.